Last spike to stop out shorts before the big move down? | 6 charts to help draw the roadmap for equities
Earnings surprise indicators suggest that equities might do well over the earnings season for Q1. On the other hand, institutional investor surveys, market breadth and the Equity Risk Premium show that there’s not much fuel to drive market higher as we approach H2’23.
But markets tend to go not where consensus expects but where the most people get hurt.
So my best guess is that we’ll see a last spike to stop out shorts before a bigger move down heading into H2’23.
Here are six factors to help draw a roadmap for equities.
1/ Premium to hold stocks at historic lows
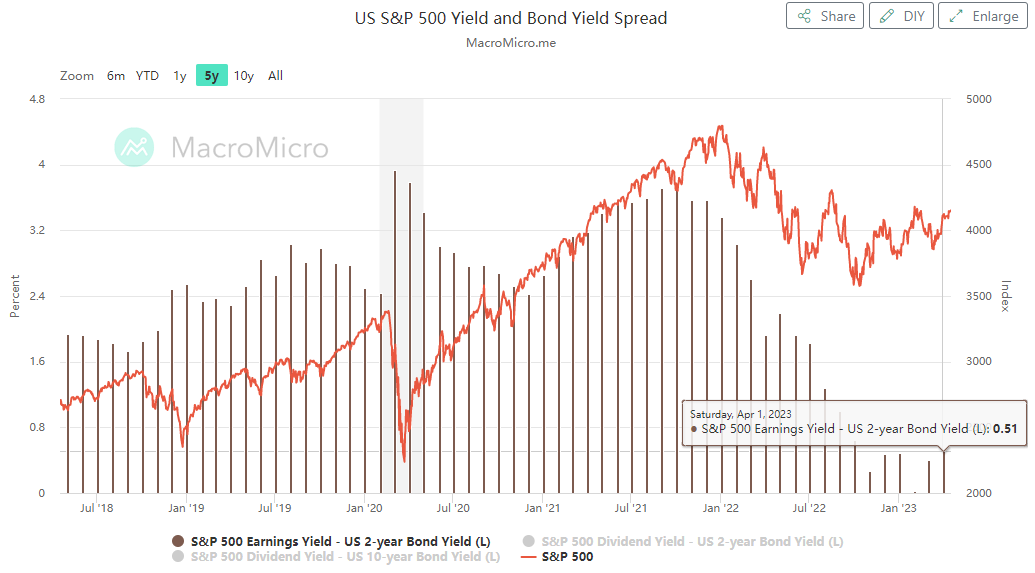
The S&P Equity Risk Premium is the gap between the S&P 500's earnings yield and that of 10-year Treasuries. The lower the ERP, the more expensive is the S&P vs bonds.
At 1.6%, the ERP is at levels not seen since 2007, while average is at 3.5%.
The S&P 500's earnings yield relative that of 2-year Treasuries is now at a measly 0.51%.
Not a super tasty deal for investors to hold an asset that makes a sharp 40 % drop around once a decade.
2/ Breadth and Nasdaq paint very different pictures
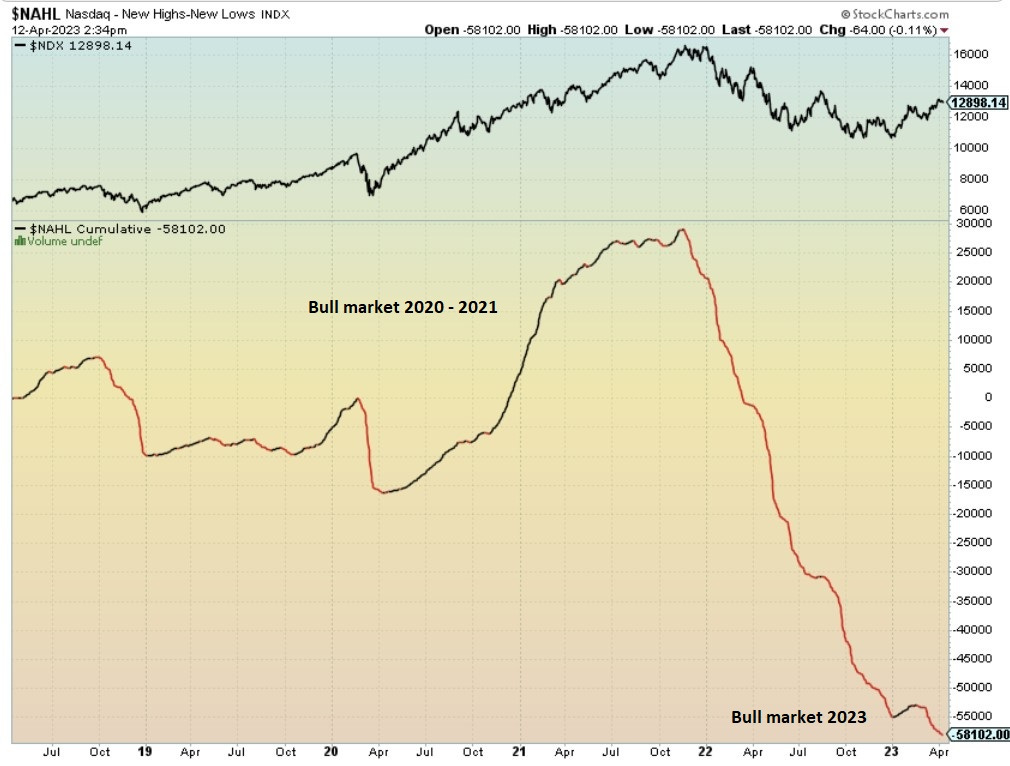
Breadth always goes up in a bull market or extremely up as in the bubble of 2020-2021. But in this edition Nasdaq's breadth (measured as cumulative net of 52week New Highs and New Lows) has continued to drop aggressively in the past six months.
3/ No institutional interest to fuel an extended bull market
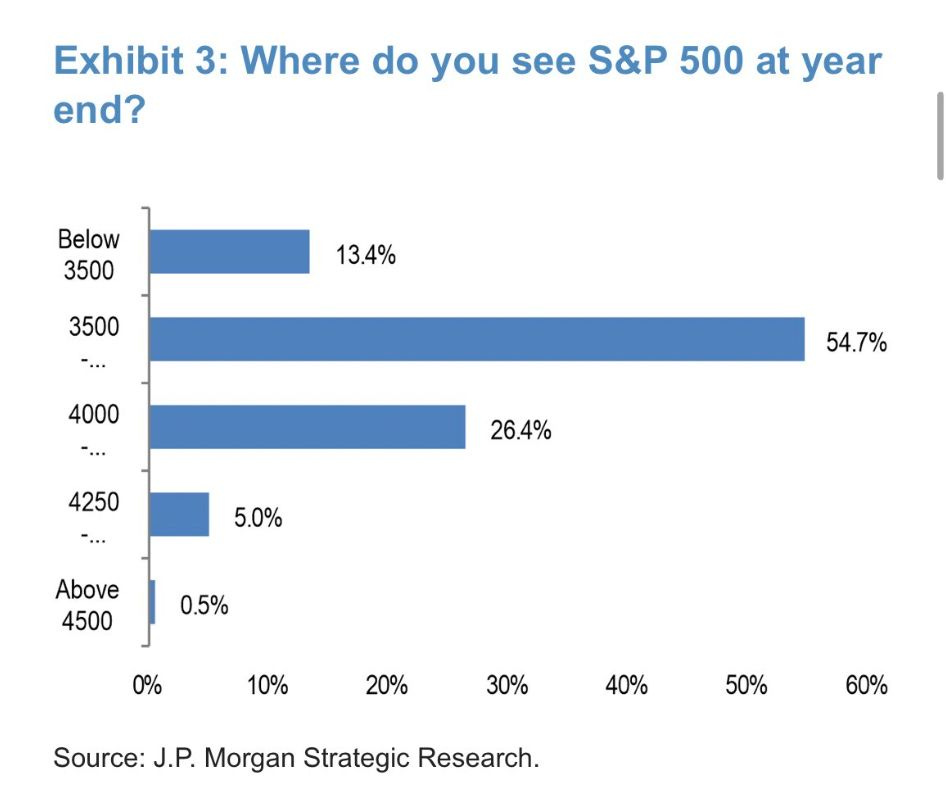
JP Morgan recently asked a number of institutional clients ”Where do you see SP500 at year end?” Only 5,5% expected it to be higher than today. Says alot about what buy side consensus thinks about equities.
Chief strategist Kolanovic: “Even in an optimistic scenario of soft landing (which even the Fed deems unlikely based on the March Board staff forecasts), equity upside is likely less than 5% and that is the return that is delivered by short-term fixed income"
Also JPM: On the downside, even a mild recession would warrant retesting the previous lows and result in 15%+ downside. ...this upside vs downside scenario illustrates why we favor risk-less assets.”
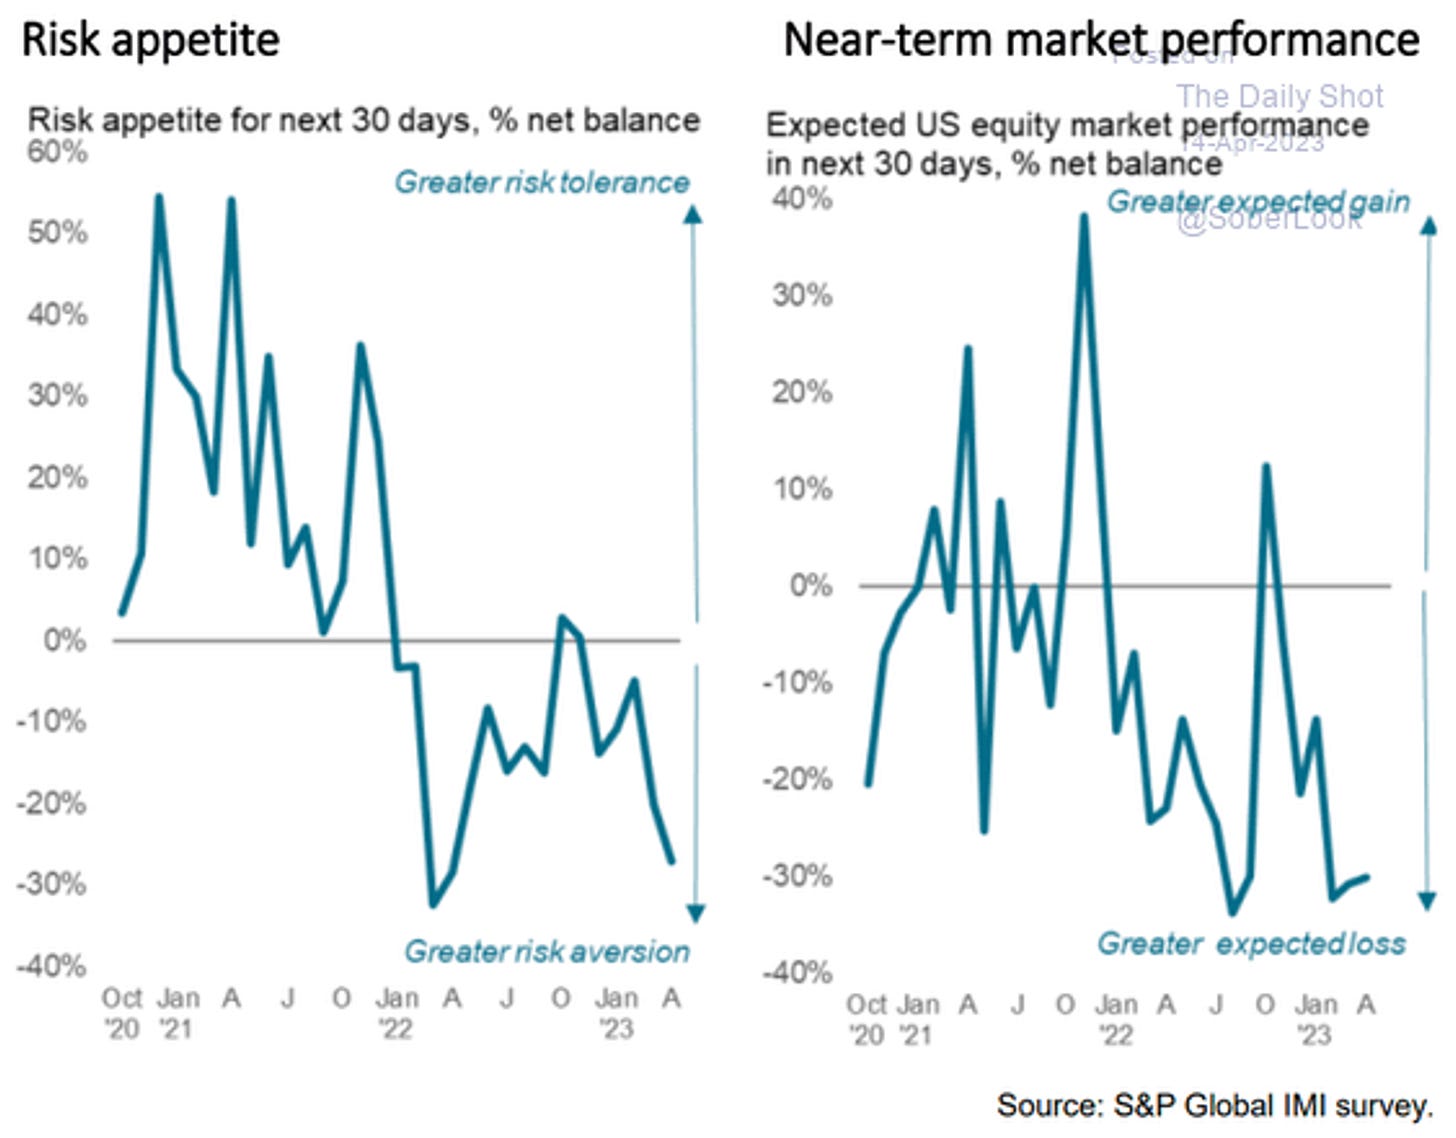
4/ Same goes for Global Investment Manager Index
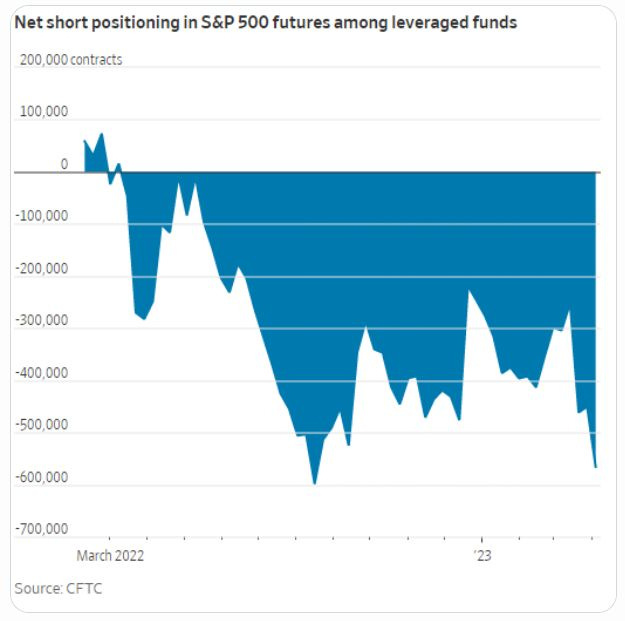
5/ Leveraged funds ready to get hurt again
Net short positioning in S&P500 futures among leveraged funds is back at levels seen in the fall of 2022.
And markets have a tendency to go where most people get hurt, like it hurt shorts in the fall of 2022.
6/ Surprise indicator support stable Q1 earnings season
The single most important determinant to how an earnings report will be received is expectations.
Macro Research firm Steno Research's surprise-based indicator suggests that the reporting season should beat expectations on average, which would support a decent equity performance short term.
(twitter has block embedded tweets on Substack, but the chart can be found here https://twitter.com/AndreasSteno/status/1648224097384398849?s=20)
So what does it all mean?
There seems to be no institutional interest to fuel a continued rise in the market and leveraged funds are positioned for a decline. Long term, breadth does not support an extended bull market.
But the market seldom does what consensus expects, and even tends to go where the most people get hurt.
My guess is that we’ll see a last spike up to stop out the shorts before the next big move down going into H2’23.
A good alternative to trying to play the broad market is to look for attractive fundamental pairs trades (like our Long DEO: Short RI) and attractive small cap cases driven by business transformation.
More on that soon.


